
Design Challenge
Stock Price Dashboard
Design Brief

My Exercise Notes
Process
Analysis
The first task was to make sense of the design brief.
The sentence "They are performing End of Week Analysis on Stack performance" threw me off for some time as I wasn't familiar with the term "Stack performance" in all my years working in the financial markets, before realising it must be a typo and the word should be "Stock" instead of "Stack."
I then examined at the users needs and matched them to the corresponding tabular data provided.
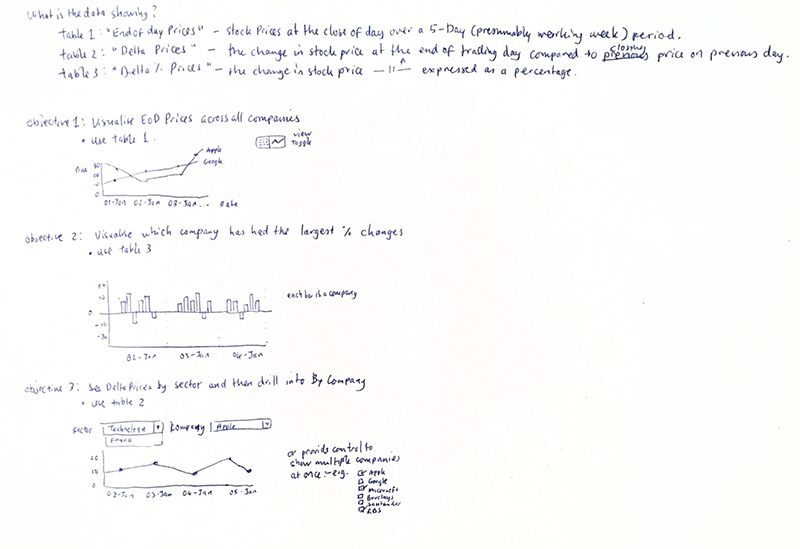
Data Visualisation
Since a requirement was to have a data visualisation view of the tabular data, I had to decide which data visualisation was most appropriate for use.
Design
Responsive Design
With the functional requirement for the application to be used on an iPad and Desktop, it meant this application needed to be responsive and I chose to use Bootstrap for the Responsive UI framework as I was familiar with it.
Layout
Due to the type of data to be displayed on the dashboard application, it was an easy decision to make the dashboard use a one column layout for portrait orientation on portable devices but for desktops and portable devices such as the iPad the application would update the layout to use two columns.
Development
AngularJS
The requirement to use AngularJS posed a problem. Besides doing some basic tutorials, I never progressed beyond the introductory chapters. This meant that I had to learn AngularJS in the two evenings I had available!
Charting Library
I chose chart.js as visualisation library as it appeared to be easier to learn compared with the more well-known D3.
